
The meek shall inherit
Spending big was no guarantee in 2023

TicketRev is the presenting sponsor of VIEW FROM THE BLEACHERS. Click to learn more, and download the TicketRev app on the App Store and Google Play to save on tickets to see the Dolphins, the Canes, Inter Miami and the rest of the games and concerts you don’t want to miss.
Created by a South Florida native and Marlins fan, TicketRev gives you the chance to name your own price for tickets to sporting events and concerts and typically saves users an average of about 20%. It’s like Priceline for tickets! And it’s easy to use.
Pick your event…
Choose your seating preference…
Name your offer price…
And let TicketRev do the rest.
Download the TicketRev app in the App Store or Google Play or learn more at TicketRev.com.

With the 2023 postseason getting started today, it’s almost as interesting to note who won’t be playing in October this season as who will be.
Major League Baseball’s 3 biggest spenders will all be sitting out the playoffs this season.
The Mets finished 74-87, 4th in the NL East and 9 1/2 games out of a playoff spot despite topping the majors with a record-breaking Opening Day payroll of $330.6 million, according to Cot’s Baseball Contracts. Including luxury tax, Steve Cohen’s club paid out a record $445 million. The Mets may want their money back. They were last above .500 June 3, traded core players for prospects at the deadline, imported former Brewers baseball operations chief David Stearns to be their new President of Baseball Operations and fired manager Buck Showalter a year after he led them to 101 wins and was NL Manager of the Year in 2022.
Owners of the 2nd-highest payroll in the majors, the Yankees needed a 20-12 finish to end the year 82-80, finishing above .500 for the 31st consecutive season, the 2nd-longest streak in ML history. Despite a season-opening payroll of $277.6 million, the Yankees missed the playoffs for the first time since 2016 and for just the 5th time in the last 29 seasons beginning in 1995.

Then there are the San Diego Padres. After reaching the NLCS a season ago, owner Peter Seidler went all-in, taking the payroll to $248.9 million to begin 2023, 3rd-highest in the majors a mere 6 years after the Padres were 29th in MLB in spending. With 5 players making at least $20 million this season, the Padres packed Petco Park night after night. They had the 3rd-best run differential in the NL and the league’s 2nd-best ERA, but they finished just 82-80, failing to win more than 3 in a row at any point this season until mid-September.
If you add the Cubs to the Yankees, Mets and Padres, 4 teams that ranked among the top 5 in dollars spent on free agents last winter missed the playoffs in 2023, while the 2 teams that spent less on free agents than any others—the Braves and Brewers—both won division titles (and the Braves had the best record in MLB).
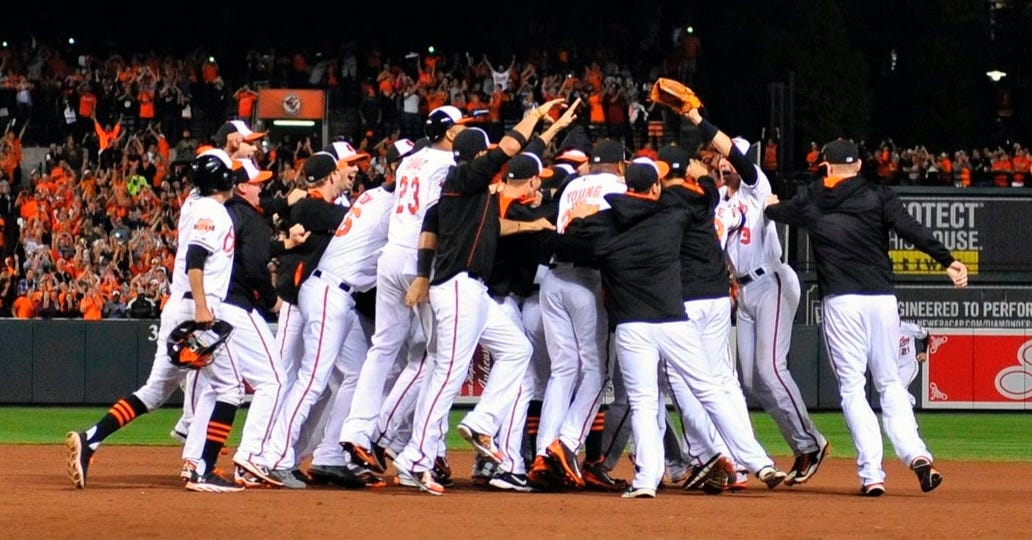
While several of baseball biggest spenders endured massively disappointing seasons, 4 of baseball’s bottom 10 payrolls will be playing in October. Only the 112-loss Oakland Athletics spent less on payroll than the #29 Orioles and the #28 Rays this season, and Baltimore and Tampa Bay were the 2 winningest teams in the AL with 101 and 99 victories respectively.
Meanwhile, the D-Backs ranked 21st in Opening Day payroll, and the Marlins were 23rd; however, both teams won NL Wild Cards.
Three of the 6 division champions—the AL Central Twins (#17), the NL Central Brewers (#20) and the AL East Orioles—ranked among the bottom half of MLB clubs in Opening Day payroll, as did half the playoff field overall.
Here’s a look at the 2023 playoff teams ranked by Opening Day payroll:
#4 Phillies $243.0 million
#5 Dodgers $222.6 million
#7 Blue Jays $209.9 million
#8 Braves $203.0 million
#9 Rangers $195.8 million
#14 Astros $179.8 million
#17 Twins $153.7 million
#20 Brewers $118.7 million
#21 D-Backs $116.1 million
#23 Marlins $92.5 million
#28 Rays $73.1 million
#29 Orioles $60.8 million
ML CLUBS RANKED BY FINAL RECORD (with payroll rank)
Braves 104-58 (Record: #1, Payroll #8)
Orioles 101-61 (Record: #2, Payroll #29)
Dodgers 100-62 (Record: #3, Payroll #5)
Rays 99-63 (Record: #4, Payroll #28)
Brewers 92-70 (Record: #5, Payroll #20)
Astros 90-72 (Record: #T6, Payroll #14)
Phillies 90-72 (Record: #T6, Payroll #4)
Rangers 90-72 (Record: #T6, Payroll #9)
Blue Jays 89-73 (Record: #9, Payroll #7)
Mariners 88-74 (Record: #10, Payroll #18)
Twins 87-75 (Record: #11, Payroll #17)
Marlins 84-77 (Record: #12, Payroll #23)
D-Backs 84-78 (Record: #13, Payroll #21)
Reds 82-80 (Record: #T14, Payroll #26)
Yankees 82-80 (Record: #T14, Payroll #2)
Giants 79-83 (Record: #16, Payroll #10)
Red Sox 78-84 (Record: #17, Payroll #12)
Guardians 76-86 (Record: #18, Payroll #25)
Angels 73-89 (Record: #19, Payroll #6)
Padres 82-80 (Record: #20, Payroll #3)
Cubs 83-79 (Record: #21, Payroll #11)
Tigers 78-84 (Record: #22, Payroll #19)
Pirates 76-86 (Record: #23, Payroll #27)
Mets 74-87 (Record: #24, Payroll #1)
Cardinals 71-91 (Record: #T25, Payroll #14)
Nationals 71-91 (Record: #T25, Payroll #22)
White Sox 61-101 (Record: #27, Payroll #13)
Rockies 59-103 (Record: #28, Payroll #16)
Royals 56-106 (Record: #29, Payroll #24)
Athletics 50-112 (Record: #30, Payroll #30)
RECORD TO PAYROLL RATIO (Payroll rank minus Record rank)
Orioles +27 (Payroll ranks 29th, record ranks 2nd)
Rays +24
Brewers +15
Reds +12
Marlins +11
D-Backs +8
Mariners +8
Astros +8
Guardians +7
Braves +7
Twins +6
Pirates +4
Rangers +3
Dodgers +2
Athletics 0
Phillies -2
Blue Jays -2
Tigers -3
Nationals -3
Royals -5
Red Sox -5
Giants -6
Cubs -10
Cardinals -11
Yankees -12
Rockies -12
Angels -13
White Sox -14
Padres -17
Mets -23
10 of the 14 teams with a positive payroll-to-record ratio are in the playoffs. The only 2 playoff teams that have a negative payroll-to-record ratio are the Phillies and Blue Jays, both at -2.
DOLLARS SPENT PER WIN (Opening Day payroll/2023 wins)
Orioles $601,980 per win
Rays $738,384 million per win
Pirates $963,158 per win
Reds $1.01 million per win
Marlins $1.10 million per win
Athletics $1.14 million per win
Guardians $1.18 million per win
Brewers $1.29 million per win
D-Backs $1.38 million per win
Nationals $1.42 million per win
Mariners $1.56 million per win
Tigers $1.57 million per win
Royals $1.65 million per win
Twins $1.77 million per win
Braves $1.95 million per win
Astros $2.00 million per win
Rangers $2.18 million per win
Cubs $2.22 million per win
Dodgers $2.23 million per win
Red Sox $2.32 million per win
Blue Jays $2.36 million per win
Giants $2.38 million per win
Cardinals $2.49 million per win
Phillies $2.70 million per win
Angels $2.90 million per win
Rockies $2.92 million per win
White Sox $2.97 million per win
Padres $3.04 million per win
Yankees $3.39 million per win
Mets $4.47 million per win
10 of the 19 most-efficient spenders are in the playoffs (the Orioles #1, the Rays #2, the Marlins #5, the Brewers 8, the D-Backs #9, the Twins #14, the Braves #15, the Astros, #16, the Rangers #17 and the Dodgers #19). The only 2 playoff teams that ranks among the clubs 20-30 in dollars spent per win are the Blue Jays at #21 and the Phillies at #24.
While you’re here…
Interested in advertising on VIEW FROM THE BLEACHERS? Contact me here to learn about opportunities to promote your business on a daily or weekly basis.
Learn more about one-on-one play-by-play coaching from Glenn Geffner via Zoom at glenngeffner.com.
Your feedback is always appreciated. Hit the “LIKE” button below if you enjoyed this post.
The cost per win discussion is reminiscent of the John Henry and Billy Beane characters' conversation in "Moneyball." I think it's a particularly clear way to view consider team efficiency. If course, it's not directly germane to profitability. I heard an Angels podcast in which the hosts posited that the Halos benefitted an "extra" $10 million per home game from Ohtani's presence. I simply cannot see how such a number is extrapolated. There are wild claims about merch sales, sponsor affinity desire, and tickets (season and single-game) sold. The same arguments are touted as reasons that a Yankee signing of Soto or Ohtani for monstrous sums would "pay for itself" because of the large Japanese and Dominican populations in New York. Sponsors might be more inclined to make big deals to be affiliated with such players, but that seems to be reaching. Besides winning seasons and considerable post-season success (consistency and depth), I doubt there is any justification for saying $400-$500m contracts are recuperated by increased ad, merch, ticket, or concession revenues.